
Your gym has been reopened for a few weeks and you’re looking at year-over-year data to see how much worse it is. Your check-ins per day are slowly increasing, but they’re still down 25-40% year-over-year. Your individual member re-engagement is also slowly increasing, and maybe 30-45% of your previously engaged members have resumed checking in. And of course you’re watching your revenue, which is still a scary 50-70% of what it was.
These changes are obvious because the numbers are in your face and you can see and feel the impacts of them in your club every day. But there are some very important changes that are not so obvious–changes that can have a serious impact on your long-term success. We’re talking about changes in Member Behavior.
Maybe prior to the pandemic you had worked out a fairly reliable formula for x number of members will yield this much in dues, this much in PT spend, this much in ancillary discretionary spend, etc. Unfortunately, current data is showing you will very likely need to rethink that formula. The members who are walking through your door today may not be the same members that walked through your door six months ago, even if they are the same people. They’re experiencing a host of disruptive, potentially behavior-changing experiences they’ve never encountered before:
- Loss of desirable amenities such as childcare, showers, saunas, etc.
- Social distancing requirements reducing social interaction opportunities
- Mask requirements (have they switched to weights in the gym, cardio at home?)
- Increased virtual training opportunities (yours and your competitors’)
- Increased competition from a growing population of independent personal trainers
- Quarantine-inspired purchases of home exercise equipment
- Extended work-from-home options (was the gym previously a convenient stop to-and-from work?)
The question isn’t just who is coming back, it’s who are they now? Using our tools, you can analyze each member’s pre-pandemic check-in and spend patterns and compare them to their post-reopening check-in and spend patterns. Members who have returned to expected patterns can be identified, and more importantly so can members who have significant increases or decreases in check-ins and spend. For example, the below report puts re-engaged members into four check-in frequency change groupings, based upon statistical analysis of recent patterns compared to historical patterns (including seasonal patterns):
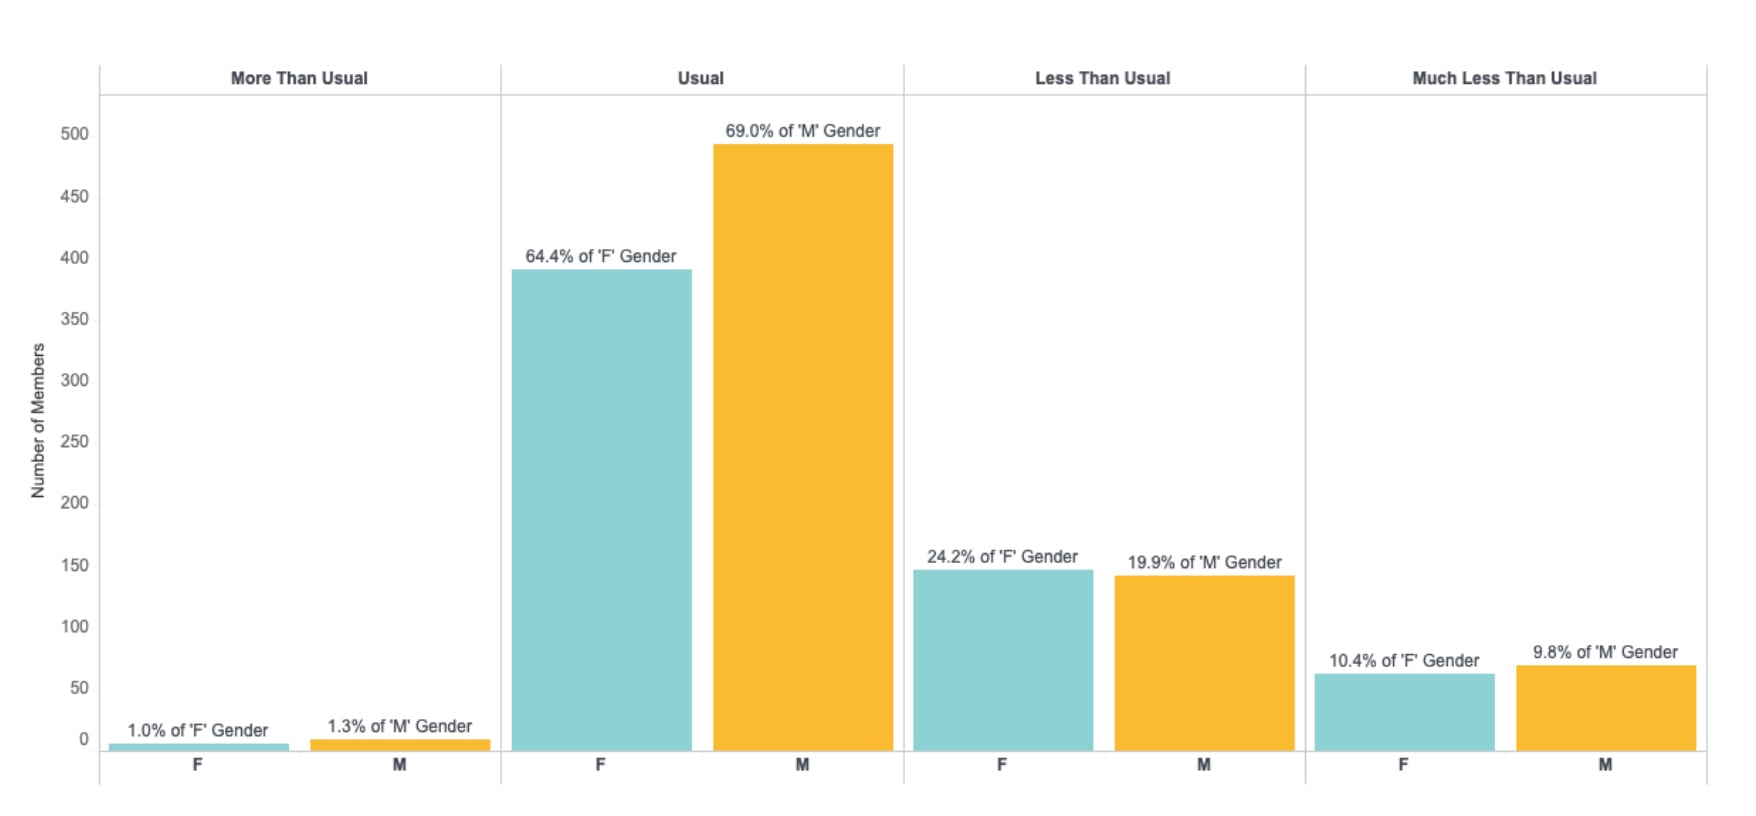
If you’re going to be operating with reduced membership for some time, and new member joins are going to be lackluster, you’re going to want to focus on these groups in different ways. The above report has the ability to drill down to detailed member lists for each behavior grouping so targeted action can be taken.
More Than Usual
These are your new champions. Not only have they returned, but they’re engaging at much higher levels than previously. They’re perfect candidates for testimonials, and these newly motivated members may be your most receptive market for sales of Personal Training services, supplements, etc.
The great thing about this report is that it detects statistically significant behavior change, rather than just relying on total check-ins. While someone who comes in 7 times a month might not normally seem remarkable, if that person had previously averaged only 2 times a month then they are a member you don’t want to overlook.
Usual
Great, they’re back just like before. But if you have fewer members (and less revenue) you will need to get more out of them than just “Usual”. Identify the members in this group who were previously high spenders and compare their current spend. Spend re-engagement is as critical as check-in re-engagement, so don’t neglect this group. Maximizing revenue per member is more important than ever right now.
Less Than Usual
This group is your early warning system. The analytics have detected a definite downward trend in check-in behavior, but it’s not extreme (yet). This might be a fairly large group, so they are perfect for a simple email survey asking one question: “What is one thing that would make your experience better?” Look for patterns in responses. Has perceived value gone down due to loss of amenities? Don’t be overly optimistic about a speedy return of all amenities (or expect your members to), plan for their absence for up to a year. Your competitors are missing the same amenities, so now is a chance to be innovative and fill the gap with something else.
Much Less Than Usual
Something has undeniably changed in a big way for this group, and these are likely to be your highest risk of impending attrition. We were hearing “retention is the new acquisition” long before the pandemic, and it seems to be more true than ever right now. These members are still coming in, so there’s still a connection, but it’s important to understand what’s causing their downward trends before you lose them.
This is an excellent group for direct phone outreach. Pick 50-100 of your highest spenders and call them. Are they engaging in more virtual training opportunities? Make sure it’s your virtual training. Are they missing a trusted trainer who is no longer there? Make a recommendation and arrange an introduction for a new one.
Many of your members are adapting to a new normal, and many of the “old rules” no longer apply. You will need to depend on smart analysis of member behavior data to learn the new rules if you want to find the most effective ways to retain members and maximize their value.
Want to learn more?
Fill out the form and a member of our team will be in-touch.